How to use wxmplot - Part 1 (Phoenix)
Keywords : wxmplot, wxPython, Matplotlib.
Contents
Demonstrating :
Tested py3.x, wx4.x and Win10.
Are you ready to use some samples ? ![]()
Test, modify, correct, complete, improve and share your discoveries ! ![]()
wxmplot :
You must install this package for use it :
pip install wxmplot
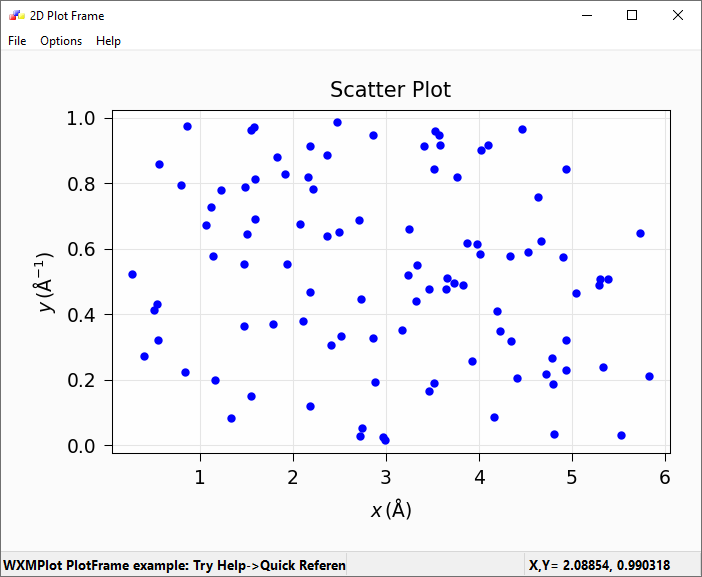
First example

   1 # sample_one.py
   2
   3 """
   4
   5 Author : Matthew Newville
   6 Link : https://newville.github.io/wxmplot/examples.html
   7
   8 """
   9
  10 # Scatterplot example, with lassoing and
  11 # a user-level lasso-callback.
  12
  13 import sys
  14 import wx
  15 import wxmplot
  16 import numpy
  17
  18 # def onlasso
  19
  20 #-------------------------------------------------------------------------------
  21
  22 x   = numpy.arange(100)/20.0 + numpy.random.random(size=100)
  23 y   = numpy.random.random(size=len(x))
  24
  25 #-------------------------------------------------------------------------------
  26
  27 def onlasso(data=None, selected=None, mask=None):
  28     print( ':: lasso ', selected)
  29
  30 #-------------------------------------------------------------------------------
  31
  32 app = wx.App()
  33
  34 pframe = wxmplot.PlotFrame()
  35 frameIcon = wx.Icon("./icons/icon_wx.ico")
  36 pframe.SetIcon(frameIcon)
  37 pframe.scatterplot(x, y, title='Scatter Plot', size=15,
  38                    xlabel='$ x\, \mathrm{(\AA)}$',
  39                    ylabel='$ y\, \mathrm{(\AA^{-1})}$')
  40 pframe.panel.lasso_callback = onlasso
  41 pframe.write_message('WXMPlot PlotFrame example: Try Help->Quick Reference')
  42 pframe.Show()
  43
  44 app.MainLoop()
Second example

   1 # sample_two.py
   2
   3 """
   4
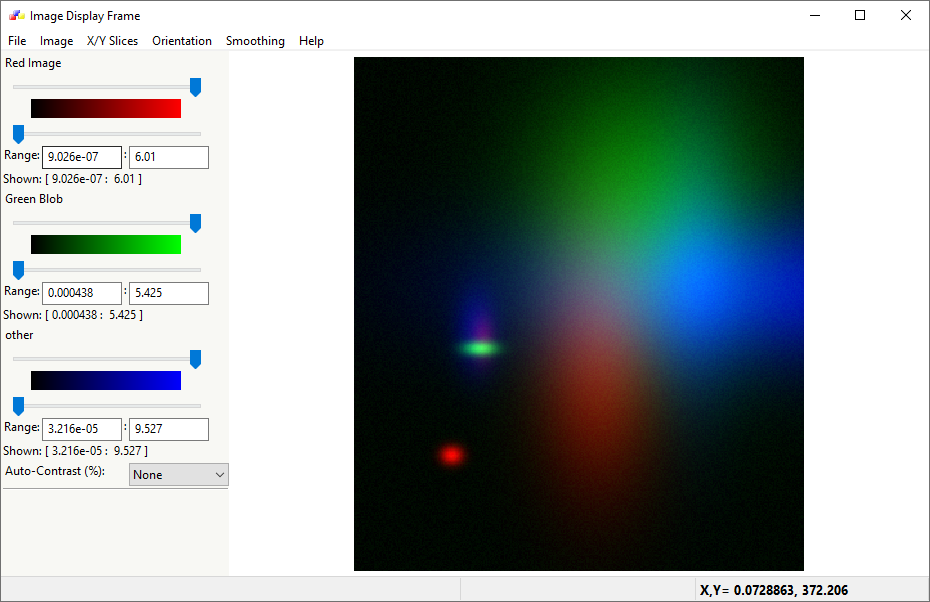
   5 Example showing display of R, G, B maps
   6 Author : Matthew Newville
   7 Link : https://newville.github.io/wxmplot/examples.html
   8
   9 """
  10
  11 import wx
  12 from numpy import exp, random, arange, outer, array
  13 from wxmplot import ImageFrame
  14
  15 # def gauss2d
  16
  17 #-------------------------------------------------------------------------------
  18
  19 def gauss2d(x, y, x0, y0, sx, sy):
  20     return outer( exp( -(((y-y0)/float(sy))**2)/2),
  21                   exp( -(((x-x0)/float(sx))**2)/2) )
  22
  23 #-------------------------------------------------------------------------------
  24
  25 if __name__ == '__main__':
  26     app = wx.App()
  27     frame = ImageFrame(mode='rgb')
  28     frameIcon = wx.Icon("./icons/icon_wx.ico")
  29     frame.SetIcon(frameIcon)
  30     ny, nx = 350, 400
  31     x = arange(nx)
  32     y = arange(ny)
  33     ox =  x / 100.0
  34     oy = -1 + y / 200.0
  35     red  = 0.02 * random.random(size=nx*ny).reshape(ny, nx)
  36     red =  red + (6.0*gauss2d(x, y, 90,   76,  5,  6) +
  37                   3.0*gauss2d(x, y, 165, 190,  70,  33) +
  38                   2.0*gauss2d(x, y, 180, 100,  12,  6))
  39     green  = 0.3 * random.random(size=nx*ny).reshape(ny, nx)
  40     green = green  + (5.0*gauss2d(x, y, 173,  98,  4,  9) +
  41                       3.2*gauss2d(x, y, 270, 230, 78, 63))
  42
  43     blue = 0.1 * random.random(size=nx*ny).reshape(ny, nx)
  44     blue = blue + (2.9*gauss2d(x, y, 240, 265,  78,  23) +
  45                    3.5*gauss2d(x, y, 185,  95,  22, 11) +
  46                    7.0*gauss2d(x, y, 220,  310,  40,  133))
  47
  48     dat = array([red, green, blue]).swapaxes(2, 0)
  49     frame.display(dat, x=ox, y=oy,
  50                   subtitles={'red':'Red Image', 'green': 'Green Blob', 'blue': 'other'})
  51     frame.Show()
  52     app.MainLoop()
Third example
1 # sample_three.py
Download source
Additional Information
Link :
https://pypi.org/project/wxmplot/
https://newville.github.io/wxmplot/examples.html
- - - - -
https://wiki.wxpython.org/TitleIndex
Thanks to
Matthew Newville (sample_one / two.py coding), the wxPython community...
About this page
Date (d/m/y) Person (bot) Comments :
06/10/20 - Ecco (Created page for wxPython Phoenix).
Comments
- blah, blah, blah....
