How to use Plot - Part 3 (Phoenix)
Keywords : Plot, Graph, Point, Sine, Cosine, PolyLine, PlotCanvas, PlotGraphics.
Contents
Demonstrating :
Tested py3.x, wx4.x and Win10.
Are you ready to use some samples ? ![]()
Test, modify, correct, complete, improve and share your discoveries ! ![]()
Plotting :
wxPython comes with a simple plotting library.
Features include zooming, legends and a grid.
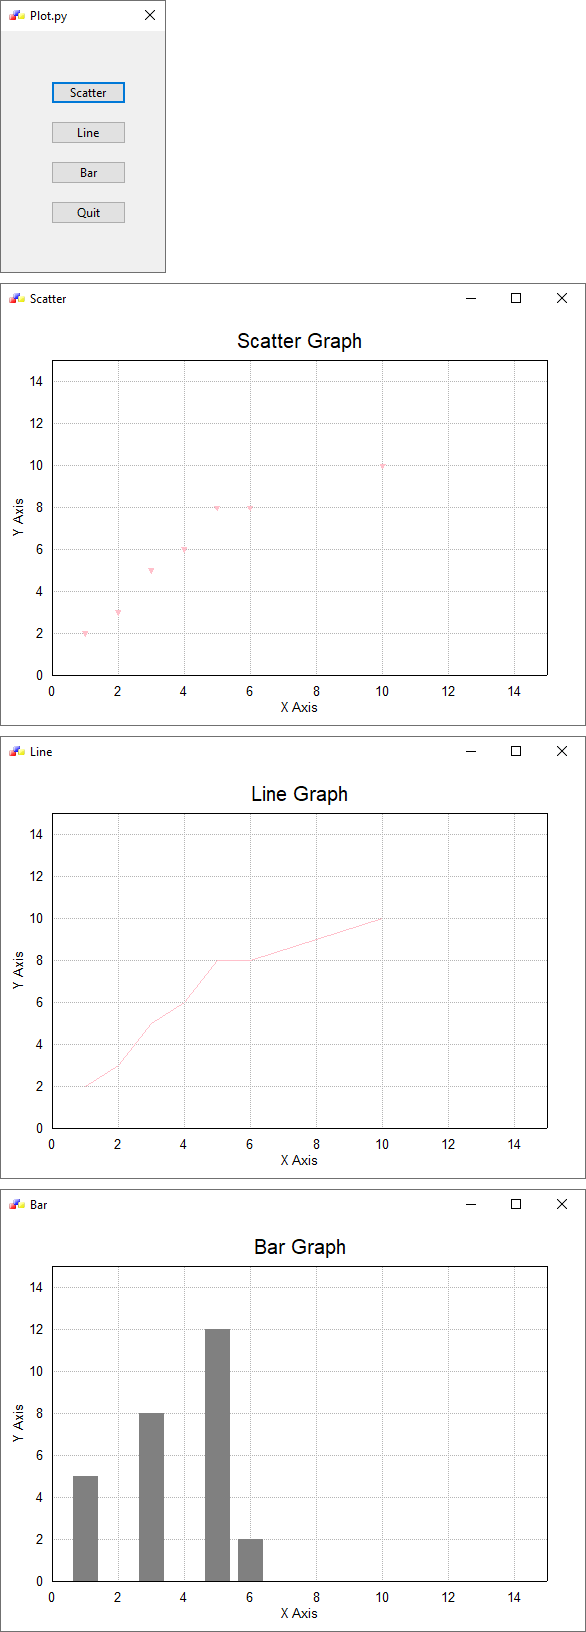
Possible graphs :
- Scatter
- Line
- Bar
We must install the Numeric library.
Other plotting libraries are :
Gnuplot or MatPlotLib.
These must be installed separately.
To create a graph, we follow these steps :
1) Define our data :
We insert your data in a list of tuples.
Each tuple will have two items.
data = [(x1, y1), (x2, y2), (x3, y3), (x4, y4), (x5, y5), (x6, y6)]
2) Create a plotting canvas we create an object of a PlotCanvas as a child of a frame :
   frame = wx.Frame(self, -1)
   client = wx.lib.plot.PlotCanvas(frame)
3) Create a graph There are two classes :
PolyLine and PolyMarker. PolyLine class defines line graphs.
Its constructor is :
PolyLine(list data, wx.Colour colour, integer width, integer style, string legend)
- data parameter is the data to be displayed.
- colour defines the colour of the line.
- width is the width of the pen, used to draw the graph.
- Possible style flags are wx.Pen styles.
- legend defines the line legend.
PolyMarker can be used to create scatter graphs and bar graphs as well.
Constructor :
PolyMarker(list data, wx.Colour colour, integer size, wx.Colour fillcolour, integer fillstyle, string markershape, string legend)
fillstyle is also various wx.Pen styles.
Marker Shapes :
- circle
- dot
- square
- triangle
- triangle_down
- cross
- plus
4) Create a graph container :
Graph container is a container that holds a graph object and its title and labels.
PlotGraphics(list objects, string title, string xLabel, string yLabel)
- objects is a list of one or more graph objects
- title - title shown at top of graph
- xLabel - label shown on x-axis
- yLabel - label shown on y-axis
5) Draw a graph :
Finally we draw the graph.
client.Draw(gc, xAxis=(0,15), yAxis=(0,15))
gc is a graph container object. xAxis and yAxis define the range of the axes (info by ZetCode / Jan Bodnar).
First example

   1 # sample_one.py
   2
   3 """
   4
   5 Author : Zetcode
   6 Created : Apr., 2007
   7 Updated : Nov. 16, 2020 by Ecco
   8
   9 """
  10
  11 import wx
  12 import wx.lib.plot as plot
  13
  14 # MyPlot
  15 # MyApp
  16
  17 #---------------------------------------------------------------------------
  18
  19 class MyPlot(wx.Dialog):
  20     def __init__(self, parent, id, title):
  21         wx.Dialog.__init__(self, parent, id, title, size=(180, 280))
  22
  23         #------------
  24
  25         icon = wx.Icon("./icons/wxwin.ico")
  26         self.SetIcon(icon)
  27
  28         #------------
  29
  30         self.data = [(1,2), (2,3), (3,5), (4,6), (5,8), (6,8), (10,10)]
  31
  32         btn1 = wx.Button(self,  1, '&Scatter', (50,50))
  33         btn2 = wx.Button(self,  2, '&Line', (50,90))
  34         btn3 = wx.Button(self,  3, '&Bar', (50,130))
  35         btn4 = wx.Button(self,  4, '&Quit', (50,170))
  36
  37         #------------
  38
  39         self.Bind(wx.EVT_BUTTON, self.OnScatter, id=1)
  40         self.Bind(wx.EVT_BUTTON, self.OnLine, id=2)
  41         self.Bind(wx.EVT_BUTTON, self.OnBar, id=3)
  42         self.Bind(wx.EVT_BUTTON, self.OnQuit, id=4)
  43         self.Bind(wx.EVT_CLOSE, self.OnQuit)
  44
  45     #-----------------------------------------------------------------------
  46
  47     def OnScatter(self, event):
  48         frm = wx.Frame(self, -1, 'Scatter', size=(600, 450))
  49         icon = wx.Icon("./icons/wxwin.ico")
  50         frm.SetIcon(icon)
  51
  52         pnl = wx.Panel(frm, -1)
  53         pnl.SetBackgroundColour(wx.WHITE)
  54
  55         #------------
  56
  57         client = plot.PlotCanvas(pnl)
  58         markers = plot.PolyMarker(self.data, legend='', colour='pink', marker='triangle_down', size=1)
  59         gc = plot.PlotGraphics([markers], 'Scatter Graph', 'X Axis', 'Y Axis')
  60         client.Draw(gc, xAxis=(0,15), yAxis=(0,15))
  61
  62         #------------
  63
  64         mainSizer = wx.BoxSizer(wx.VERTICAL)
  65         mainSizer.Add(client, 1, wx.EXPAND | wx.ALL, 10)
  66         pnl.SetSizer(mainSizer)
  67
  68         #------------
  69
  70         frm.Show(True)
  71
  72
  73     def OnLine(self, event):
  74         frm = wx.Frame(self, -1, 'Line', size=(600, 450))
  75         icon = wx.Icon("./icons/wxwin.ico")
  76         frm.SetIcon(icon)
  77
  78         pnl = wx.Panel(frm, -1)
  79         pnl.SetBackgroundColour(wx.WHITE)
  80
  81         #------------
  82
  83         client = plot.PlotCanvas(pnl)
  84         line = plot.PolyLine(self.data, legend='', colour='pink', width=1)
  85         gc = plot.PlotGraphics([line], 'Line Graph', 'X Axis', 'Y Axis')
  86         client.Draw(gc,  xAxis= (0,15), yAxis= (0,15))
  87
  88         #------------
  89
  90         mainSizer = wx.BoxSizer(wx.VERTICAL)
  91         mainSizer.Add(client, 1, wx.EXPAND | wx.ALL, 10)
  92         pnl.SetSizer(mainSizer)
  93
  94         #------------
  95
  96         frm.Show(True)
  97
  98
  99     def OnBar(self, event):
 100         frm = wx.Frame(self, -1, 'Bar', size=(600, 450))
 101         icon = wx.Icon("./icons/wxwin.ico")
 102         frm.SetIcon(icon)
 103
 104         pnl = wx.Panel(frm, -1)
 105         pnl.SetBackgroundColour(wx.WHITE)
 106
 107         #------------
 108
 109         client = plot.PlotCanvas(pnl)
 110         bar1 = plot.PolyLine([(1, 0), (1,5)], legend='', colour='gray', width=25)
 111         bar2 = plot.PolyLine([(3, 0), (3,8)], legend='', colour='gray', width=25)
 112         bar3 = plot.PolyLine([(5, 0), (5,12)], legend='', colour='gray', width=25)
 113         bar4 = plot.PolyLine([(6, 0), (6,2)], legend='', colour='gray', width=25)
 114         gc = plot.PlotGraphics([bar1, bar2, bar3, bar4],'Bar Graph', 'X Axis', 'Y Axis')
 115         client.Draw(gc, xAxis=(0,15), yAxis=(0,15))
 116
 117         #------------
 118
 119         mainSizer = wx.BoxSizer(wx.VERTICAL)
 120         mainSizer.Add(client, 1, wx.EXPAND | wx.ALL, 10)
 121         pnl.SetSizer(mainSizer)
 122
 123         #------------
 124
 125         frm.Show(True)
 126
 127
 128     def OnQuit(self, event):
 129         self.Destroy()
 130
 131 #---------------------------------------------------------------------------
 132
 133 class MyApp(wx.App):
 134    def OnInit(self):
 135          dlg = MyPlot(None, -1, 'Plot.py')
 136          dlg.Show(True)
 137          dlg.Centre()
 138
 139          return True
 140
 141 #---------------------------------------------------------------------------
 142
 143 app = MyApp(0)
 144 app.MainLoop()
Download source
Additional Information
Link :
https://www.blog.pythonlibrary.org/2010/09/27/wxpython-pyplot-graphs-with-python/
- - - - -
https://wiki.wxpython.org/TitleIndex
Thanks to
Jan Bodnar / ZetCode (sample_one.py coding), the wxPython community...
About this page
Date (d/m/y) Person (bot) Comments :
16/11/20 - Ecco (Created page for wxPython Phoenix).
Comments
- blah, blah, blah....
