How to use Plot - Part 2 (Phoenix)
Keywords : Plot, Graph, Point, Sine, Cosine, PolyLine, PlotCanvas, PlotGraphics.
Contents
Demonstrating :
Tested py3.x, wx4.x and Win10.
Are you ready to use some samples ? ![]()
Test, modify, correct, complete, improve and share your discoveries ! ![]()
Plot :
First example

   1 # sample_one.py
   2
   3 """
   4
   5 Using wxPython for plotting
   6 Author : Vegaseat
   7 Created : 19 apr 2007
   8 Updated : Octo. 19, 2020 by Ecco
   9 Link : https://www.daniweb.com/programming/software-development/code/216913/using-wxpython-for-plotting
  10
  11 """
  12
  13 import os
  14 import sys
  15 import wx
  16 import wx.lib.plot as plot
  17
  18 # class MyFrame
  19 # class MyApp
  20
  21 #---------------------------------------------------------------------------
  22
  23 class MyFrame(wx.Frame):
  24     def __init__(self):
  25         wx.Frame.__init__(self, None, wx.ID_ANY,
  26                           title="wx.lib.plot")
  27
  28         #------------
  29
  30         # Return icons folder.
  31         self.icons_dir = wx.GetApp().GetIconsDir()
  32
  33         #------------
  34
  35         # Add a panel so it looks the correct on all platforms.
  36         panel = wx.Panel(self)
  37         panel.SetBackgroundColour("white")
  38
  39         #------------
  40
  41         self.plotter = plot.PlotCanvas(panel)
  42         self.plotter.SetInitialSize(size=(410, 340))
  43         # Enable the zoom feature (drag a box around area of interest).
  44         # self.plotter.SetEnableZoom(True)
  45
  46         toggleZoom = wx.CheckBox(panel, label="Show zoom")
  47         toggleZoom.SetValue(False)
  48         toggleZoom.Bind(wx.EVT_CHECKBOX, self.OnToggleZoom)
  49
  50         #------------
  51
  52         # Create some sizers.
  53         mainSizer = wx.BoxSizer(wx.VERTICAL)
  54         checkSizer = wx.BoxSizer(wx.HORIZONTAL)
  55
  56         # Layout the widgets.
  57         mainSizer.Add(self.plotter, 1, wx.EXPAND | wx.ALL, 10)
  58         checkSizer.Add(toggleZoom, 0, wx.ALL, 5)
  59         mainSizer.Add(checkSizer)
  60         panel.SetSizer(mainSizer)
  61
  62         #------------
  63
  64         # List of (x,y) data point tuples.
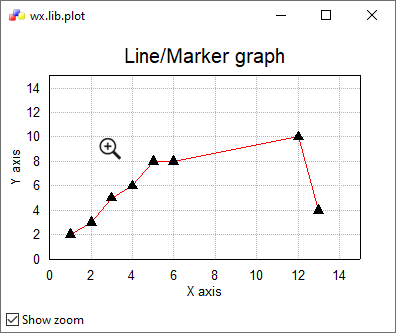
  65         data = [(1, 2), (2, 3), (3, 5), (4, 6), (5, 8), (6, 8), (12, 10), (13, 4)]
  66
  67         # Draw points as a line.
  68         line = plot.PolyLine(data, colour='red', width=1)
  69
  70         # Also draw markers, default colour is black and size is 2.
  71         # Other shapes 'circle', 'cross', 'square', 'dot', 'plus'.
  72         marker = plot.PolyMarker(data, marker='triangle')
  73
  74         # Set up text, axis and draw.
  75         gc = plot.PlotGraphics([line, marker], 'Line/Marker graph', 'X axis', 'Y axis')
  76         self.plotter.Draw(gc, xAxis=(0, 15), yAxis=(0, 15))
  77
  78         #------------
  79
  80         # Simplified init method.
  81         self.SetProperties()
  82
  83     #-----------------------------------------------------------------------
  84
  85     def SetProperties(self):
  86         """
  87         ...
  88         """
  89
  90         self.SetMinSize((410, 340))
  91         self.SetBackgroundColour(wx.WHITE)
  92
  93         #------------
  94
  95         frameIcon = wx.Icon(os.path.join(self.icons_dir,
  96                                          "wxwin.ico"),
  97                             type=wx.BITMAP_TYPE_ICO)
  98         self.SetIcon(frameIcon)
  99
 100
 101     def OnToggleZoom(self, event):
 102         """
 103         Enable the zoom feature (drag a box around area of interest).
 104         """
 105
 106         # self.canvas.SetEnableZoom(event.IsChecked())
 107         self.plotter.enableZoom = event.IsChecked()
 108
 109 #---------------------------------------------------------------------------
 110
 111 class MyApp(wx.App):
 112     def OnInit(self):
 113
 114         #------------
 115
 116         self.installDir = os.path.split(os.path.abspath(sys.argv[0]))[0]
 117
 118         #------------
 119
 120         frame = MyFrame()
 121         self.SetTopWindow(frame)
 122         frame.Show(True)
 123
 124         return True
 125
 126     #-----------------------------------------------------------------------
 127
 128     def GetInstallDir(self):
 129         """
 130         Return the installation directory for my application.
 131         """
 132
 133         return self.installDir
 134
 135
 136     def GetIconsDir(self):
 137         """
 138         Return the icons directory for my application.
 139         """
 140
 141         icons_dir = os.path.join(self.installDir, "icons")
 142         return icons_dir
 143
 144 #---------------------------------------------------------------------------
 145
 146 def main():
 147     app = MyApp(False)
 148     app.MainLoop()
 149
 150 #---------------------------------------------------------------------------
 151
 152 if __name__ == "__main__" :
 153     main()
Second example

   1 # sample_two.py
   2
   3 """
   4
   5 Author : Beppe
   6 Created : Sept. 22, 2010
   7 Updated : Octo. 21, 2020 by Ecco
   8 Link : https://www.blog.pythonlibrary.org/2010/09/27/wxpython-pyplot-graphs-with-python/
   9
  10 """
  11
  12 import os
  13 import sys
  14 import wx
  15 import wx.lib.plot as plot
  16
  17 # class MyPLot
  18 # class MyForm
  19 # class MyApp
  20
  21 #---------------------------------------------------------------------------
  22
  23 class MyPLot(plot.PlotCanvas):
  24     def __init__(self, parent, id):
  25         plot.PlotCanvas.__init__(self, parent, -1)
  26
  27     #-----------------------------------------------------------------------
  28
  29     def PlotGraph(self):
  30         """
  31         ...
  32         """
  33
  34         # self.SetEnableLegend(True)
  35         # self.SetEnableGrid(True)
  36
  37         #------------
  38
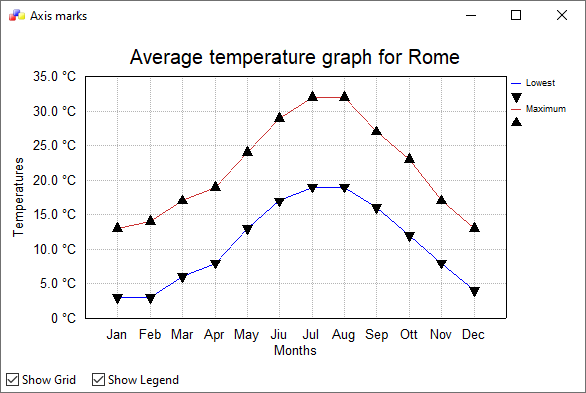
  39         min_value = [(1, 3), (2, 3), (3, 6), (4, 8), (5, 13), (6, 17),
  40                      (7, 19), (8, 19), (9, 16), (10, 12), (11, 8), (12, 4)]
  41
  42         max_value = [(1, 13), (2, 14), (3, 17), (4, 19), (5, 24), (6, 29),
  43                      (7, 32), (8, 32), (9, 27), (10, 23), (11, 17), (12, 13)]
  44
  45         #------------
  46
  47         min_line = plot.PolyLine(min_value, legend="Lowest", colour='blue', width=1)
  48         min_marker = plot.PolyMarker(min_value, marker='triangle_down')
  49
  50         max_line = plot.PolyLine(max_value, legend="Maximum", colour='orange', width=1)
  51         max_marker = plot.PolyMarker(max_value, marker='triangle')
  52
  53         #------------
  54
  55         gc = plot.PlotGraphics([min_line, min_marker, max_line, max_marker],
  56                                "Average temperature graph for Rome",
  57                                'Months',
  58                                'Temperatures')
  59
  60         self.Draw(gc, xAxis=(0, 13), yAxis=(0, 35))
  61
  62
  63     def _xticks(self, *args):
  64         """
  65         Override  _xticks to write months on x axis.
  66         """
  67
  68         ticks = plot.PlotCanvas._xticks(self, *args)
  69         new_ticks = []
  70
  71         month = ("",'Jan','Feb','Mar','Apr','May','Jiu',
  72                  'Jul','Aug','Sep','Ott','Nov','Dec')
  73
  74         for k,v in enumerate(month):
  75             s = str(month[int(k)])
  76             new_ticks.append((k, s))
  77
  78         return new_ticks
  79
  80
  81     def _yticks(self, *args):
  82         """
  83         Override  _yticks to write centigrade on y axis.
  84         """
  85
  86         ticks = plot.PlotCanvas._yticks(self, *args)
  87         new_ticks = []
  88
  89         for tick in ticks:
  90             t = tick[0]
  91             s = str(" %s °C" %t)
  92             new_ticks.append( (t, s) )
  93
  94         return new_ticks
  95
  96 #---------------------------------------------------------------------------
  97
  98 class MyForm(wx.Frame):
  99     def __init__(self):
 100         wx.Frame.__init__(self, None, -1,
 101                           title="Axis marks",
 102                           size=(600, 400))
 103
 104         #------------
 105
 106         # Return icons folder.
 107         self.icons_dir = wx.GetApp().GetIconsDir()
 108
 109         #------------
 110
 111         panel = wx.Panel(self)
 112
 113         self.canvas = MyPLot(panel, -1)
 114
 115         toggleGrid = wx.CheckBox(panel, label="Show Grid")
 116         toggleGrid.SetValue(True)
 117         toggleGrid.Bind(wx.EVT_CHECKBOX, self.OnToggleGrid)
 118
 119         toggleLegend = wx.CheckBox(panel, label="Show Legend")
 120         toggleLegend.SetValue(False)
 121         toggleLegend.Bind(wx.EVT_CHECKBOX, self.OnToggleLegend)
 122
 123         #------------
 124
 125         mainSizer = wx.BoxSizer(wx.VERTICAL)
 126         checkSizer = wx.BoxSizer(wx.HORIZONTAL)
 127
 128         mainSizer.Add(self.canvas, 1, wx.EXPAND | wx.ALL, 10)
 129         checkSizer.Add(toggleGrid, 0, wx.ALL, 5)
 130         checkSizer.Add(toggleLegend, 0, wx.ALL, 5)
 131
 132         mainSizer.Add(checkSizer)
 133
 134         panel.SetSizer(mainSizer)
 135         self.Layout()
 136
 137         #------------
 138
 139         # Simplified init method.
 140         self.SetProperties()
 141
 142     #-----------------------------------------------------------------------
 143
 144     def SetProperties(self):
 145         """
 146         ...
 147         """
 148
 149         self.SetMinSize((600, 400))
 150         self.SetBackgroundColour(wx.WHITE)
 151
 152         #------------
 153
 154         frameIcon = wx.Icon(os.path.join(self.icons_dir,
 155                                          "wxwin.ico"),
 156                             type=wx.BITMAP_TYPE_ICO)
 157         self.SetIcon(frameIcon)
 158
 159
 160     def OnToggleGrid(self, event):
 161         """
 162         ...
 163         """
 164
 165         # self.canvas.SetEnableGrid(event.IsChecked())
 166         self.canvas.enableGrid = event.IsChecked()
 167
 168
 169     def OnToggleLegend(self, event):
 170         """
 171         ...
 172         """
 173
 174         # self.canvas.SetEnableLegend(event.IsChecked())
 175         self.canvas.enableLegend = event.IsChecked()
 176
 177
 178     def OnOpen(self):
 179         """
 180         ...
 181         """
 182
 183         self.canvas.PlotGraph()
 184
 185 #---------------------------------------------------------------------------
 186
 187 class MyApp(wx.App):
 188     def OnInit(self):
 189
 190         #------------
 191
 192         self.installDir = os.path.split(os.path.abspath(sys.argv[0]))[0]
 193
 194         #------------
 195
 196         frame = MyForm()
 197         frame.OnOpen()
 198         self.SetTopWindow(frame)
 199         frame.Show(True)
 200
 201         return True
 202
 203     #-----------------------------------------------------------------------
 204
 205     def GetInstallDir(self):
 206         """
 207         Return the installation directory for my application.
 208         """
 209
 210         return self.installDir
 211
 212
 213     def GetIconsDir(self):
 214         """
 215         Return the icons directory for my application.
 216         """
 217
 218         icons_dir = os.path.join(self.installDir, "icons")
 219         return icons_dir
 220
 221 #---------------------------------------------------------------------------
 222
 223 def main():
 224     app = MyApp(False)
 225     app.MainLoop()
 226
 227 #---------------------------------------------------------------------------
 228
 229 if __name__ == "__main__" :
 230     main()
Third example

   1 # sample_three.py
   2
   3 """
   4
   5 Using wxPython for plotting
   6 Author : Vegaseat
   7 Created : 19 apr 2007
   8 Updated : Octo. 19, 2020 by Ecco
   9 Link : https://www.daniweb.com/programming/software-development/code/216913/using-wxpython-for-plotting
  10
  11 """
  12
  13 import os
  14 import sys
  15 import wx
  16 import wx.lib.plot as plot
  17
  18 # class MyFrame
  19 # class MyApp
  20
  21 #---------------------------------------------------------------------------
  22
  23 class MyFrame(wx.Frame):
  24     def __init__(self):
  25         style = wx.DEFAULT_FRAME_STYLE ^ (wx.RESIZE_BORDER |
  26                                           wx.MAXIMIZE_BOX)
  27         wx.Frame.__init__(self, None, wx.ID_ANY,
  28                           title="wx.lib.plot",
  29                           size=(500, 340),
  30                           style=style)
  31
  32         #------------
  33
  34         # Return icons folder.
  35         self.icons_dir = wx.GetApp().GetIconsDir()
  36
  37         #------------
  38
  39         # Add a panel so it looks the correct on all platforms.
  40         self.panel = wx.Panel(self)
  41         self.panel.SetBackgroundColour("white")
  42
  43         #------------
  44
  45         self.button = wx.Button(self.panel, -1, "&Update", (200, 265))
  46         self.button.Bind(wx.EVT_BUTTON, self.OnRedraw)
  47
  48         self.plotter = plot.PlotCanvas(self.panel)
  49         self.plotter.SetInitialSize(size=(500, 250))
  50
  51         #------------
  52
  53         # List of (x,y) data point tuples.
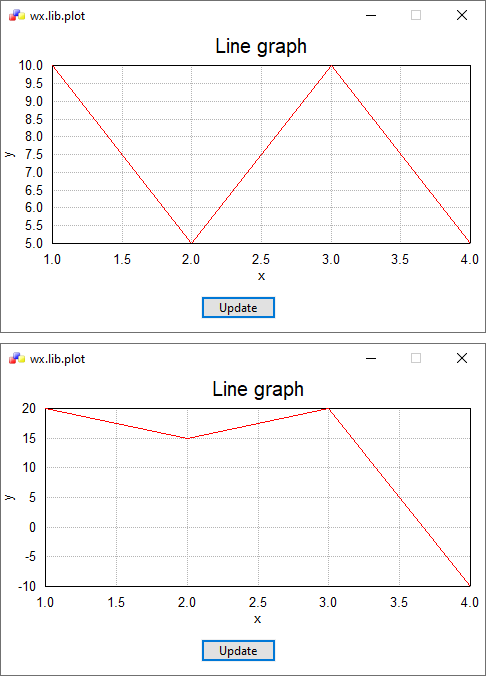
  54         data = [[1, 10], [2, 5], [3, 10], [4, 5]]
  55         line = plot.PolyLine(data, colour='red', width=1)
  56
  57         gc = plot.PlotGraphics([line], 'Line graph', 'x', 'y')
  58         self.plotter.Draw(gc)
  59
  60         #------------
  61
  62         # Simplified init method.
  63         self.SetProperties()
  64
  65     #-----------------------------------------------------------------------
  66
  67     def SetProperties(self):
  68         """
  69         ...
  70         """
  71
  72         self.SetMinSize((500, 340))
  73         self.SetBackgroundColour(wx.WHITE)
  74
  75         #------------
  76
  77         frameIcon = wx.Icon(os.path.join(self.icons_dir,
  78                                          "wxwin.ico"),
  79                             type=wx.BITMAP_TYPE_ICO)
  80         self.SetIcon(frameIcon)
  81
  82
  83     def OnRedraw(self, event):
  84         """
  85         ...
  86         """
  87
  88         self.plotter = plot.PlotCanvas(self.panel)
  89         self.plotter.SetInitialSize(size=(500, 250))
  90
  91         data2 = [[1, 20], [2, 15], [3, 20], [4, -10]]
  92         line = plot.PolyLine(data2, colour='red', width=1)
  93
  94         gc = plot.PlotGraphics([line], 'Line graph', 'x', 'y')
  95         self.plotter.Draw(gc)
  96
  97 #---------------------------------------------------------------------------
  98
  99 class MyApp(wx.App):
 100     def OnInit(self):
 101
 102         #------------
 103
 104         self.installDir = os.path.split(os.path.abspath(sys.argv[0]))[0]
 105
 106         #------------
 107
 108         frame = MyFrame()
 109         self.SetTopWindow(frame)
 110         frame.Show(True)
 111
 112         return True
 113
 114     #-----------------------------------------------------------------------
 115
 116     def GetInstallDir(self):
 117         """
 118         Return the installation directory for my application.
 119         """
 120
 121         return self.installDir
 122
 123
 124     def GetIconsDir(self):
 125         """
 126         Return the icons directory for my application.
 127         """
 128
 129         icons_dir = os.path.join(self.installDir, "icons")
 130         return icons_dir
 131
 132 #---------------------------------------------------------------------------
 133
 134 def main():
 135     app = MyApp(False)
 136     app.MainLoop()
 137
 138 #---------------------------------------------------------------------------
 139
 140 if __name__ == "__main__" :
 141     main()
Download source
Additional Information
Link :
https://www.blog.pythonlibrary.org/2010/09/27/wxpython-pyplot-graphs-with-python/
- - - - -
https://wiki.wxpython.org/TitleIndex
Thanks to
Vegaseat (sample_one / three.py coding), Beppe (sample_two.py coding), Daniweb.com, the wxPython community...
About this page
Date (d/m/y) Person (bot) Comments :
22/10/20 - Ecco (Created page for wxPython Phoenix).
Comments
- blah, blah, blah....
